




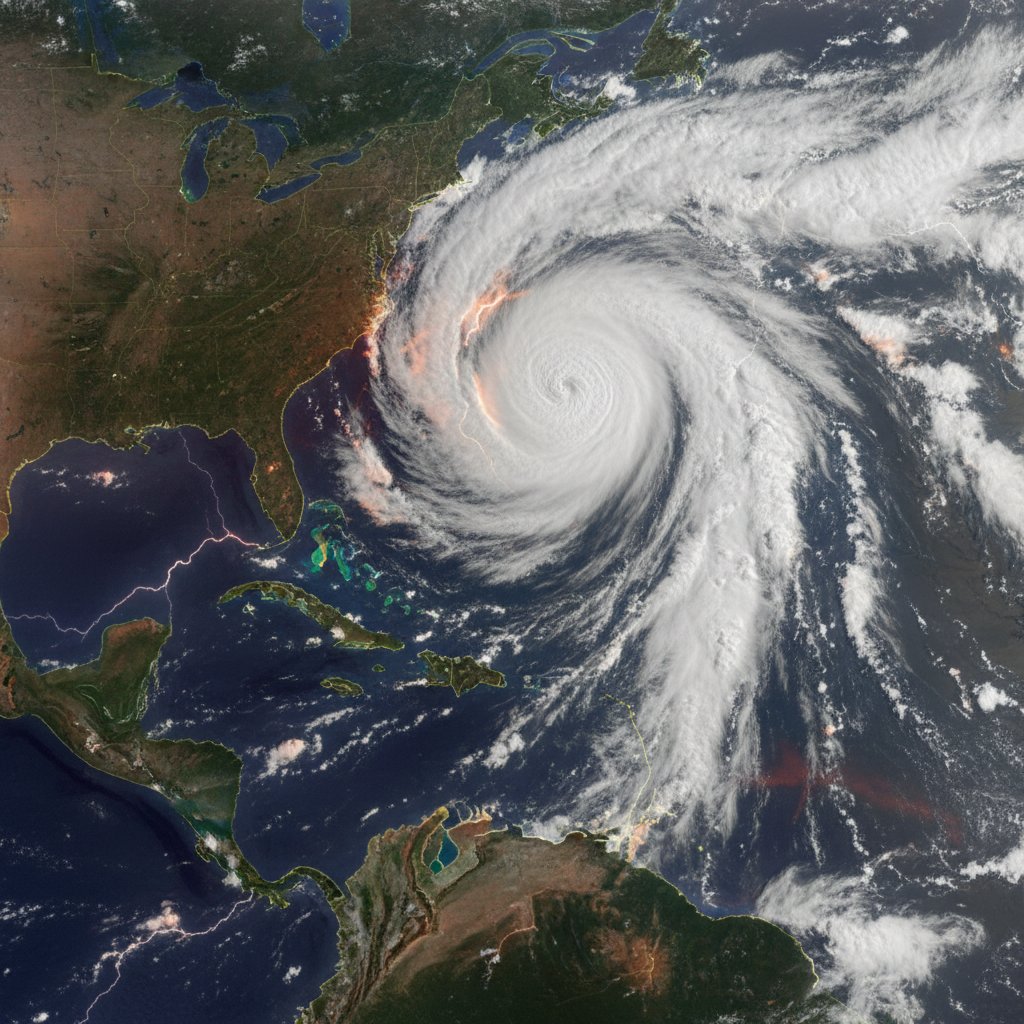
What does the latest satellite imagery reveal about the severe weather barreling toward the US West Coast? A sprawling, ribbon-like band of deep moisture stretching across the Pacific is now clearly visible from space, signaling a high-impact atmospheric river event that is expected to unleash torrential rain, heavy mountain snow, and dangerous flooding from Northern California to Washington over the next 72 hours.
The satellite view, captured by NOAA’s GOES-West satellite, shows a classic “Pineapple Express” pattern—a narrow corridor of subtropical moisture originating near Hawaii. This plume is aimed directly at the coast, with satellite-derived precipitable water values exceeding 200% of normal for late January.
A River in the Sky: What the Satellite Sees
Infrared and water vapor channels reveal a long, continuous stream of moisture more than 1,500 miles long and 300 miles wide. Dark, striated bands in the water vapor imagery indicate strong winds aloft that are transporting immense amounts of water vapor toward the continent.
At the leading edge, a cold front is already beginning to interact with the coastal mountains. The satellite loop shows towering thunderstorm tops developing offshore, a sign of intense upward motion and potential for convective bursts. These are the hallmarks of a strong AR (atmospheric river) event—rated as AR 4 on the 5-level scale used by the Center for Western Weather and Water Extremes.
“This is a textbook example of a powerful atmospheric river that we can track in real time from space. The satellite data gives us crucial lead time—up to 48 hours—to warn communities about the potential for flash flooding and debris flows, especially in burn scar areas.”
Forecasters are already noting the similarities to the devastating January 2023 series of storms that caused billions in damage across California. The current satellite signature closely resembles the February 2017 event that triggered widespread flooding and led to the catastrophic failure of the Oroville Dam spillway.
Historical Context: Comparisons to Past Storms
To put the current imagery in perspective, scientists have examined satellite records going back to the 1990s. The moisture flux rate—the amount of water vapor being transported—is currently projected to reach the 90th percentile for this time of year. That puts it in the same league as the 1862 “Great Flood” of California, though that event was far more prolonged.
Satellite technology has revolutionized how we analyze these events. In the past, forecasters relied on a sparse network of weather balloons and ships. Today, geostationary satellites provide updates every 10 minutes, allowing experts to track subtle shifts in the plume’s orientation. A slight wobble of just 50 miles north or south can mean the difference between catastrophic flooding in downtown San Francisco or a relatively manageable rain event.
“The satellite view is our first line of defense. It tells us where the energy is going before the rain even starts.” says Dr. Mark Rivera, a climatologist at UCLA who studies paleoclimate records. “We can overlay modern satellite data with tree-ring reconstructions of past floods. The patterns are eerily consistent.”
Expert Analysis: The Science Behind the Imagery
The term “atmospheric river” became part of the public lexicon only within the last two decades, thanks largely to satellite research. The current imagery shows a phenomenon that was poorly understood before space-based observations: the fine-scale structure of moisture transport.
High-resolution visible satellite views during daylight hours show the intricate cloud bands and embedded convection. At night, infrared bands that measure cloud-top temperatures reveal how high the storms are punching into the atmosphere. Top temperatures below -70°C indicate very deep thunderstorms capable of producing intense rainfall rates exceeding two inches per hour.
“Watching this satellite loop is like seeing a fire hose aimed at the coast. The water vapor channel is particularly instructive because it tracks the mid-level moisture that fuels these rain events.” explains Chen. “We’re already detecting a rapid increase in atmospheric moisture content ahead of the main frontal passage.”
A key concern for emergency managers is that this event follows a dry November and December, which left vegetation unusually dry. The first heavy rain will cause significant runoff over hardened soils, raising the risk of urban flooding and debris flows in recently burned areas like the Lake County burn scars from 2024’s wildfires.
What This Means for Residents and Emergency Services
For millions of West Coast residents, the satellite view is a clear signal to prepare. Evacuation warnings have already been issued in parts of Sonoma and Napa counties, where burn scars are vulnerable. The National Weather Service has highlighted a high risk of flash flooding for the San Francisco Bay Area on Wednesday, the first such “High Risk” outlook for the region since December 2021.
Local agencies are prepositioning flood barriers and sandbags. The California Governor’s Office of Emergency Services has activated its operations center. All of these actions are informed by the same satellite data that the public can now view in real time on weather apps and websites.
“This is not a typical storm. The satellite clearly shows we’re dealing with a significant atmospheric river. Residents in low-lying areas should have a plan and be ready to move quickly.” says Lisa Thompson, Emergency Manager for Marin County.
The satellite view also underscores the need for improved resilience. As climate change warms the atmosphere, the saturation vapor pressure increases by about 7% per degree Celsius. That means future atmospheric rivers could carry even more moisture. The current event may be a harbinger of what’s to come.
Meanwhile, the polar jet stream is dipping south, interacting with this subtropical plume, which could cause the system to stall and deliver even more concentrated rainfall over a narrow region. If that happens, the satellite will show a tightening of the moisture gradient—a telltale sign that the worst is yet to come.
Over the next 48 hours, the satellite view will be watched closely by scientists, forecasters, and emergency managers across the West Coast. Every wobble in the plume, every burst of convection, will be interpreted against the backdrop of history. The question remains: will this be a routine winter storm or a generational flood? The satellite holds the first clues.