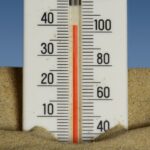








The current El Niño event has already surpassed the 1997-1998 monster in sea surface temperature anomalies across the central Pacific. The Nino3.4 region — the key index for measuring El Niño strength — hit +2.1°C in October. That’s higher than the 1997 peak of +2.0°C. And it’s still climbing.
We knew this Super El Niño would be intense. Climate models had been flashing warnings since early 2023. But the latest data suggests the atmosphere is responding even more violently than anticipated. The question now: how much worse can it get?
How Strong Is This El Niño Really?
The Oceanic Niño Index (ONI) — a three-month running mean of sea surface temperatures — reached +1.9°C in September-October-November. That ties the 2015-2016 event for the second-highest ONI on record, just behind 1997-1998’s +2.0°C. But here’s the kicker: the weekly Nino3.4 values have already blown past those historic peaks.
According to NOAA’s Climate Prediction Center, the latest weekly SST anomaly hit +2.4°C in early November. That’s territory we’ve never seen in the satellite era. “We’re essentially in uncharted waters,” says Dr. Emily Becker, lead ENSO forecaster at NOAA. “The atmosphere is coupling with the ocean in ways that are amplifying the signal beyond what our models predicted.”
And it’s not just the ocean. The Southern Oscillation Index (SOI) — which measures atmospheric pressure differences — has plummeted to -2.5, values typically seen only during extreme El Niños. The trade winds have collapsed across the equatorial Pacific. That’s the engine driving this thing.
Why Forecasts Keep Getting Worse
Earlier this year, most dynamical models predicted a peak around +1.5°C to +1.8°C. But by late summer, those forecasts started drifting upward. By October, the ensemble mean was hitting +2.0°C. Now some individual runs are showing +2.5°C or higher by December.
“The models have consistently underestimated the intensity of this event,” explains Dr. Wenju Cai, climate scientist at CSIRO in Australia. “Part of the reason is that we’re seeing a stronger than expected Bjerknes feedback — the ocean and atmosphere reinforcing each other. It’s a classic El Niño mechanism, but the magnitude is surprising.”
This isn’t just academic. A stronger El Niño means more dramatic shifts in global weather patterns. The jet stream gets displaced, tropical convection zones shift, and the entire planet’s energy balance gets thrown off. For a sense of how extreme things can get, look at the last time Earth saw conditions like this — we’re approaching levels not seen since the Pliocene epoch.
“We’re essentially in uncharted waters. The atmosphere is coupling with the ocean in ways that are amplifying the signal beyond what our models predicted.” — Dr. Emily Becker, NOAA
What This Means for the Upcoming Winter
For the United States, a Super El Niño typically means a wetter, cooler winter across the southern tier — from California to Florida — and warmer, drier conditions in the Pacific Northwest and Ohio Valley. But the magnitude of this event could supercharge those patterns.
California is already bracing for another round of atmospheric rivers. The NOAA Climate Prediction Center is forecasting above-normal precipitation for most of the Southwest through January. But with SST anomalies this high, the risk of extreme flooding events increases dramatically. Remember what happened in Northern Illinois this past July? Record-breaking rainfall totals that were linked to a stalled frontal boundary — something El Niño can help set up.
And it’s not just rain. The warmer Pacific means more energy for tropical cyclones. The western Pacific has already seen Super Typhoon Bavi slam Rota with 290 km/h winds — a storm that drew strength from the anomalously warm waters. The Atlantic hurricane season was suppressed by strong wind shear this year, but next year could be a different story if El Niño decays slowly.
Global Ripple Effects
Indonesia and Australia are already feeling the heat — literally. Severe drought conditions are developing across Papua New Guinea and parts of northern Australia. The Indian monsoon has been erratic. And the Amazon rainforest is experiencing another dry spell that could push the region closer to a tipping point.
“This El Niño is loading the dice for extreme events across multiple continents simultaneously,” says Dr. Michael Mann, climate scientist at the University of Pennsylvania. “We’re seeing the kind of synchronized extremes that climate models have warned about for years. The difference is it’s happening now.”
The economic toll is mounting. Crop yields in Southeast Asia are projected to drop 10-15%. Shipping routes through the Panama Canal are restricted due to low water levels. And energy markets are bracing for higher heating demand in the southern US.
One thing is clear: this El Niño isn’t done yet. The peak typically occurs in December or January, and some models suggest it could persist into early 2024 before weakening. That means the worst may still be ahead.
For now, forecasters are watching the weekly Nino3.4 updates like hawks. Every tenth of a degree matters. And if the current trajectory holds, we could be looking at the strongest El Niño in recorded history — perhaps by a significant margin.
Stay tuned. This story is far from over.
Frequently Asked Questions
How does this El Niño compare to 2015-2016?
The 2015-2016 event peaked at an ONI of +2.0°C and was tied for the strongest on record with 1997-1998. Current weekly Nino3.4 anomalies are already higher than both of those peaks. If the ONI reaches +2.1°C or higher, this will officially be the strongest El Niño in the modern record.
Will this El Niño cause more hurricanes?
El Niño typically suppresses Atlantic hurricane activity by increasing wind shear. However, it enhances Pacific typhoon activity. The western Pacific has already seen multiple super typhoons this year. If El Niño decays rapidly next spring, Atlantic conditions could become more favorable for storms.
When will this El Niño peak and how long will it last?
Most models indicate a peak in December 2023 or January 2024, followed by a gradual weakening through spring. Some forecasts suggest it could persist into early summer, but the exact duration depends on how quickly the ocean-atmosphere coupling breaks down.